

Solar flares — May 20, 2023
The strongest solar flare in the day
Flare of M8.9 level (strong) — in 12:35
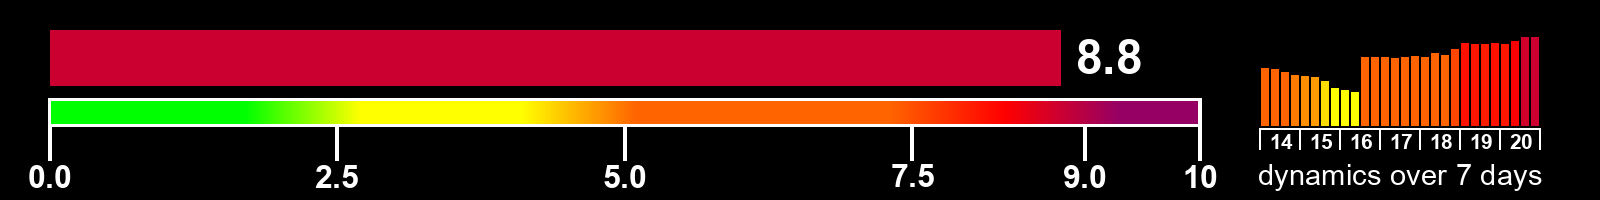
Solar activity index
Value for May 20, 2023 24:00 (end on the day). The maximum value is 10.0
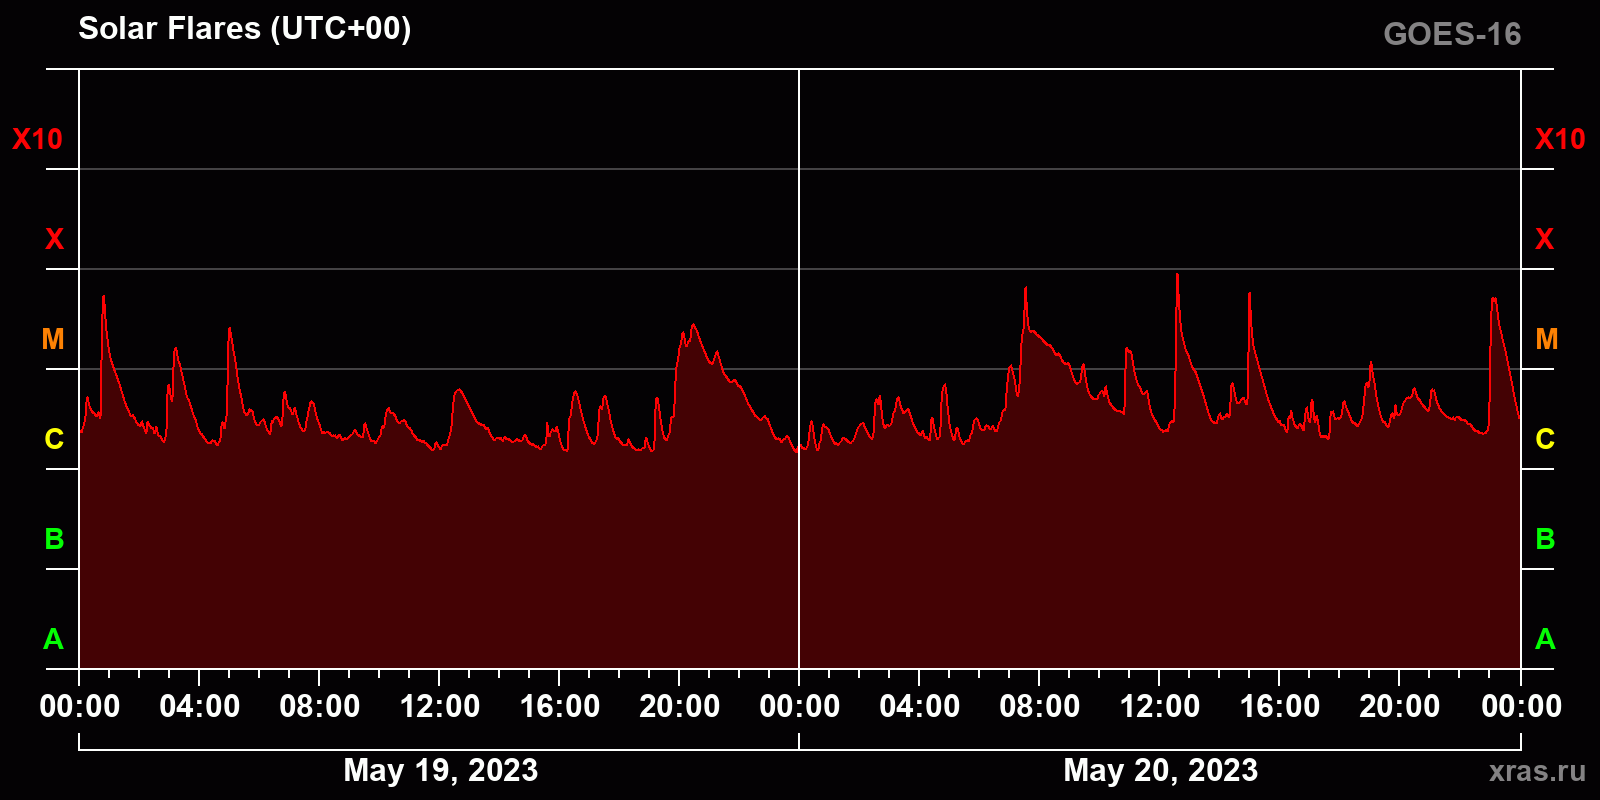
Solar flares in 2 days
Chart of solar activity from May 19, 2023 to May 20, 2023
Time zone — UTC+00 (London)
This chart in PNG format — high resolution
API data: JSON or TXT
List of solar flares for May 20, 2023
Total number of flares of class C and higher — 27 flares
C type — 19 | M type — 8 | X type — 0
| start | maximum | end | region | |
|---|---|---|---|---|
|
M5.1
|
22:52 | 23:06 | 23:21 | 3311 |
|
C6.1
|
20:57 | 21:04 | 21:14 | 3311 |
|
C6.4
|
20:19 | 20:28 | 20:34 | 3305 |
|
C5.1
|
19:57 | 20:17 | 20:19 | 3305 |
|
C3.6
|
19:37 | 19:45 | 19:57 | 3312 |
|
M1.1
|
18:57 | 19:03 | 19:07 | 3311 |
|
C7.2
|
18:42 | 18:54 | 18:57 | 3311 |
|
C4.7
|
17:59 | 18:08 | 18:15 | 3311 |
|
C3.7
|
17:37 | 17:46 | 17:59 | 3311 |
|
C4.9
|
17:00 | 17:05 | 17:09 | 3311 |
|
C4.1
|
16:48 | 16:54 | 16:58 | 3311 |
|
C3.3
|
16:14 | 16:18 | 16:30 | 3311 |
|
M5.6
|
14:54 | 15:00 | 15:04 | 3311 |
|
C7.2
|
14:18 | 14:25 | 14:33 | 3311 |
|
M8.9
|
12:25 | 12:35 | 12:40 | 3311 |
|
M1.6
|
10:48 | 10:54 | 11:10 | 3311 |
|
M1.1
|
09:18 | 09:27 | 09:32 | 3312 |
|
M6.4
|
07:16 | 07:32 | 07:36 | 3311 |
|
M1.0
|
06:49 | 07:02 | 07:12 | 3311 |
|
C3.2
|
05:42 | 05:53 | 06:01 | 3311 |
|
C6.9
|
04:36 | 04:50 | 04:57 | 3312 |
|
C3.2
|
04:18 | 04:24 | 04:30 | 3312 |
|
C5.1
|
03:08 | 03:17 | 03:22 | 3305 |
|
C5.4
|
02:37 | 02:40 | 02:44 | 3311 |
|
C4.9
|
02:24 | 02:33 | 02:37 | 3311 |
|
C2.7
|
00:37 | 00:47 | 01:02 | 3305 |
|
C2.9
|
00:13 | 00:23 | 00:29 | 3312 |